 Madeline Ruid
The Global X Renewable Energy Producers ETF (RNRG) tracks the Indxx Renewable Energy Producers Index and provides efficient access to dozens of leading companies within the Renewable Energy theme. It seeks to invest in companies that produce energy from renewable sources including wind, solar, hydroelectric, geothermal, and biofuels.
Planet Earth’s climate is changing for the worse. Heightened concentrations of atmospheric CO2 are driving long-term temperature trends upward, resulting in devastating environmental impacts. The causal relationship between human-produced greenhouse gas (GHG) emissions and such impacts is “unequivocal,” according to the International Panel on Climate Change’s (IPCC) landmark 2021 report (AR6).1 But just as human activity created the current climate predicament, our innovation and investment may also be the antidote. Among the most critical aspects of global decarbonization efforts will be transitioning to clean and renewable energy sources, a shift which will require investing tens of trillions of dollars in the coming decades.
In the following piece, we investigate the global climate crisis and evaluate the role clean and renewable energy sources can play in addressing it.
Key Takeaways
- Heightened levels of atmospheric CO2 and related temperature increases threaten lives, livelihoods, and Earth’s natural environment. Renewable energy and clean technologies are among the best tools available to limit further impacts.
- Limiting warming to 1.5 °C above preindustrial levels through emissions reductions can avert many of the negative potential impacts of climate change. This would entail tens of trillions of dollars of investment in renewable energy and clean technologies.
- Renewable and clean energy sources are continuing to gain share on fossil fuel-based sources as related technologies become more affordable. We expect to see continued adoption, driven by electrification, economies of scale, and climate action.
Setting the Stage: The Global Climate Crisis
Temperatures on Earth are reaching new heights. The past four decades were successively hotter than all preceding ones dating back to at least 1850, and the average temperature from 2011-2020 was ~1.09 °C warmer than that of 1850-1900 (preindustrial period).2 Almost all of this warming is the direct result of heightened atmospheric GHG concentrations, primarily of CO2, irrespective of source (human-produced or not).3, 4 For the first time in history, the IPCC called this causal relationship “unequivocal” in their landmark 2021 report (AR6).5 GHGs act as atmospheric insulators, absorbing heat from the Earth’s surface and releasing it over time. Naturally occurring GHGs are what kept the planet warm enough for habitation and were regulated by ocean absorption and plant photosynthesis. Today, though, GHG levels are far from natural and the planet cannot keep up.
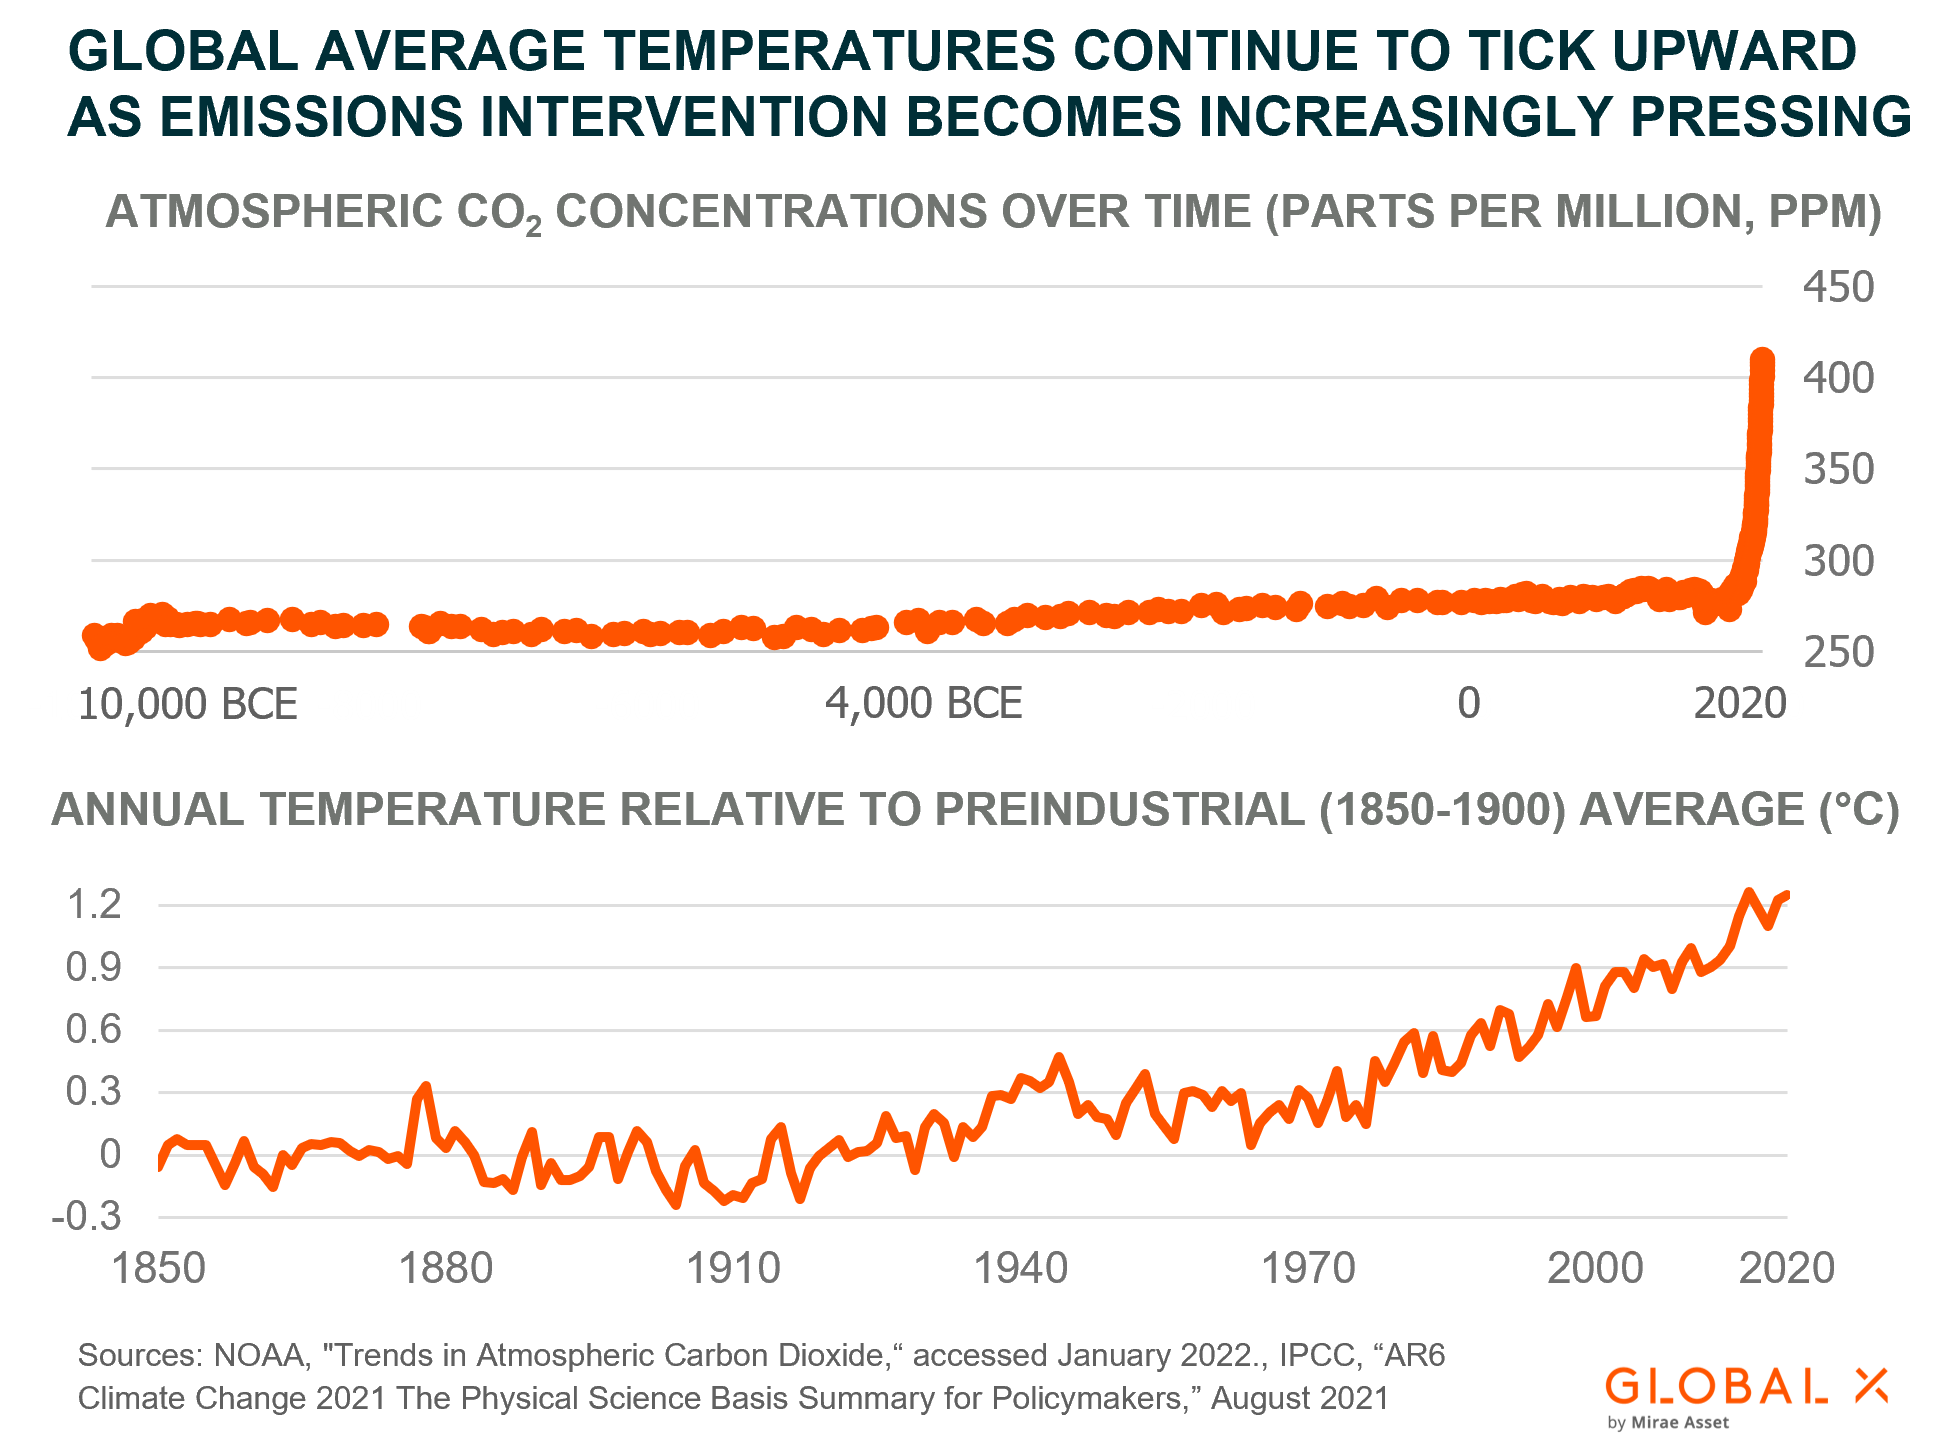
Atmospheric data reveal that the average concentration of CO2 from 2010-2020 was 43% higher than the preindustrial average, increasing from 289.3 parts per million (ppm) to 414.01 ppm as of October 2021.6 This increase occurred 100x faster than any known natural increase, including the several-thousand-year period that ended the most recent ice age.7 And in 2019, CO2 concentrations reached levels higher than at any point in the past 2 million years.8 That this began shortly following the industrial revolution in the 20th century is no coincidence. Human-produced emissions are almost solely responsible for heightened GHG levels and resulting temperature increases. The burning of fossil fuels for energy is the primary culprit. Since 1990, fossil-fuel energy sources produced 74% of annual CO2 emissions, on average.9, 10
The impacts of emissions and warming are already in effect, and all at once:11
- The intensity and frequency of extreme temperatures and heatwaves on land have increased since the 1950s, while ocean heatwaves have doubled since the 1980s.
- Heavy precipitation events have become more frequent and intense since the 1950s. Somewhat counterintuitively, agricultural and ecological droughts have also increased since then as a result of warmer temperatures.
- Over the past 100 years, oceans warmed faster than they did in the 11,000 years prior, resulting in retreating glaciers and melting sea ice. Relatedly, sea levels rose faster than over any comparable time-period in the 3,000 years prior. Oceans are also getting more acidic due to heightened CO2 absorption.
- Hurricanes have become more frequent over the past 40 years, beyond what can be explained by natural variability. Warmer oceans and rising sea levels make these storms more intense and damaging, also moving them northward as warmer temperatures introduce new breeding grounds.
Connected through the water cycle, among other systems, these impacts are resulting in devastation from natural disasters to water scarcity, and food shortages, all of which threaten lives, livelihoods, and global economies (see our research on Clean Water & AgTech & Food Innovation for related analysis).12 This is just with ~1.1°C of warming. Under the emissions policies in place as of 2021, temperatures in 2100 could fall in the range of 2.1-3.9°C above preindustrial levels.13 Just 2°C of warming would significantly increase the intensity and frequency of extreme “once-every-ten-year” weather events, with extreme heat events occurring 5.6x more often and 2.6°C hotter, extreme precipitation 1.7x more often and 14% wetter, and extreme droughts 2.4x more frequently and 0.6 standard deviations drier (see endnote 15 for further details on standard deviation).14, 15 The impact on human life would be immeasurable. Clearly, current interventions are not enough.
Clean & Renewable Energy as a Solution to Climate Change
2016’s Paris Agreement formalized the legally binding goal of limiting warming to well below 2°C warmer than preindustrial levels. The agreement highlights 1.5°C of warming as an achievable objective that would drastically limit the above-mentioned impacts of climate change.
UN-sponsored climate negotiations at the recent COP26 conference resulted in an agreement between nearly 200 nations that builds on the Paris Agreement in key areas.16 This agreement, known as the Glasgow Pact, reaffirms goals set by the Paris Agreement and acknowledges that the world’s climate change efforts must accelerate over the next decade to avoid the worst outcomes. Additionally, the Glasgow Pact acknowledges the central role fossil fuels play in climate change and calls for the phasedown of coal usage.
COP26 yielded several other impactful agreements between smaller groups of attendees. Such agreements include:
- The U.S. and China unexpectedly agreed to boost cooperation on renewable energy generation, developing regulations, and deploying clean technologies.17
- About 450 banks, pension managers, and other firms committed to align 100% of their funds with net-zero emissions targets by 2050. Together these firms command $130T in assets, enough to address a large portion of necessary clean technology investments.18
- About 100 countries agreed to cut methane emissions 30% by 2030.19 Methane contains ~80x more warming potential than carbon dioxide, so curtailing this gas could have the most immediate impact of any of the deals struck at COP26.20
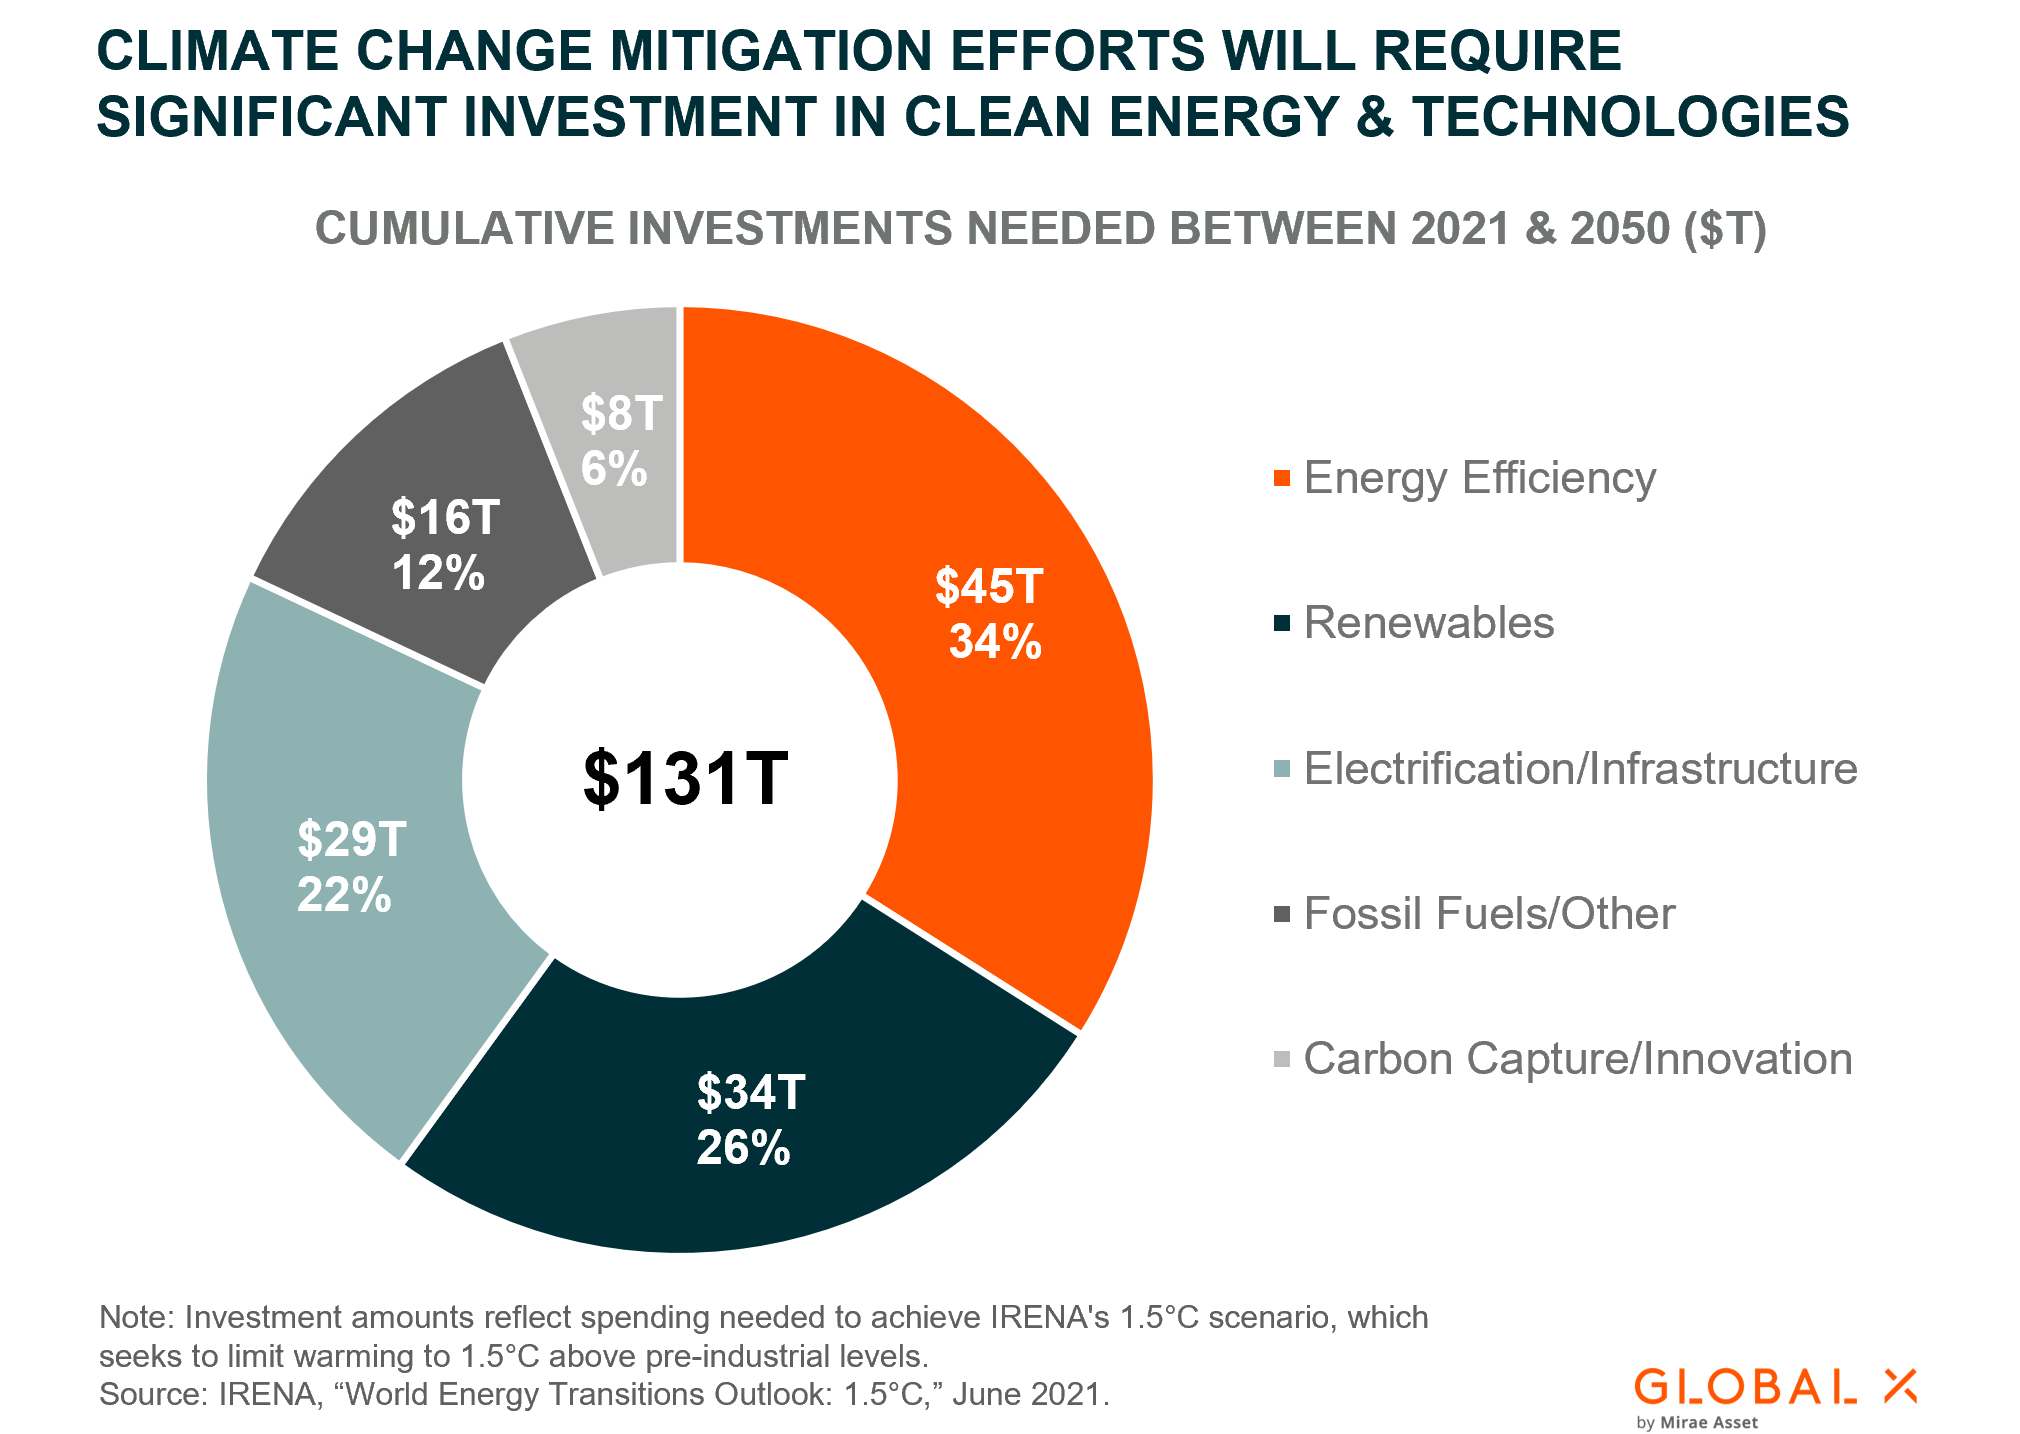
Existing legislation, commitments, and targets would require $98T of total investment between 2021 and 2050, with $10T directed to renewable energy, $13T to renewable energy-enabling electric infrastructure for transportation and heat, $32T to energy efficiency technologies, and the remainder to fossil fuels.21 While this is considerable and should benefit companies involved in producing renewable energy and clean technologies in the near- and long-term, acceptable warming paths will likely require substantially more. IRENA’s implementation-focused 1.5°C scenario estimates that overall investment should increase to $131T over the same period, significantly increasing the proportions directed to renewable energy and electrification.22 By 2050, such investment, alongside prudent implementation, could bring net annual emissions down to -0.4 Gigatons of CO2 (GtCO2/yr), a significant improvement from the 36.5 GtCO2/yr that is likely on our current pathway.23
We expect to see investment in renewables and clean technology surpass what current policy suggests, regardless of future government action because many of these technologies also make sense from an economic and business standpoint:
- Employment in the renewable energy sector is rapidly growing and should continue to increase as the transition away from fossil fuels continues (see following sections), especially in a world that is still reeling from the COVID-19 pandemic.
- Over 75% of the global population lives in a country that is a net importer of fossil fuels. Renewable energy could provide energy and economic independence.24
- Renewable electricity is becoming cheaper than electricity produced by fossil fuels (see following sections). For this reason and others, companies like Amazon and Walmart* have already announced plans to decarbonise using renewable energy and clean technologies.25
*For full fund holding information please follow the attached link to the Global X Renewable Energy Producers ETF (RNRG) overview page where relevant information can be found under the “Holdings & Characteristics” tab.
Solar Photovoltaic (PV) & Wind Power Are Driving the Renewable Energy Transition
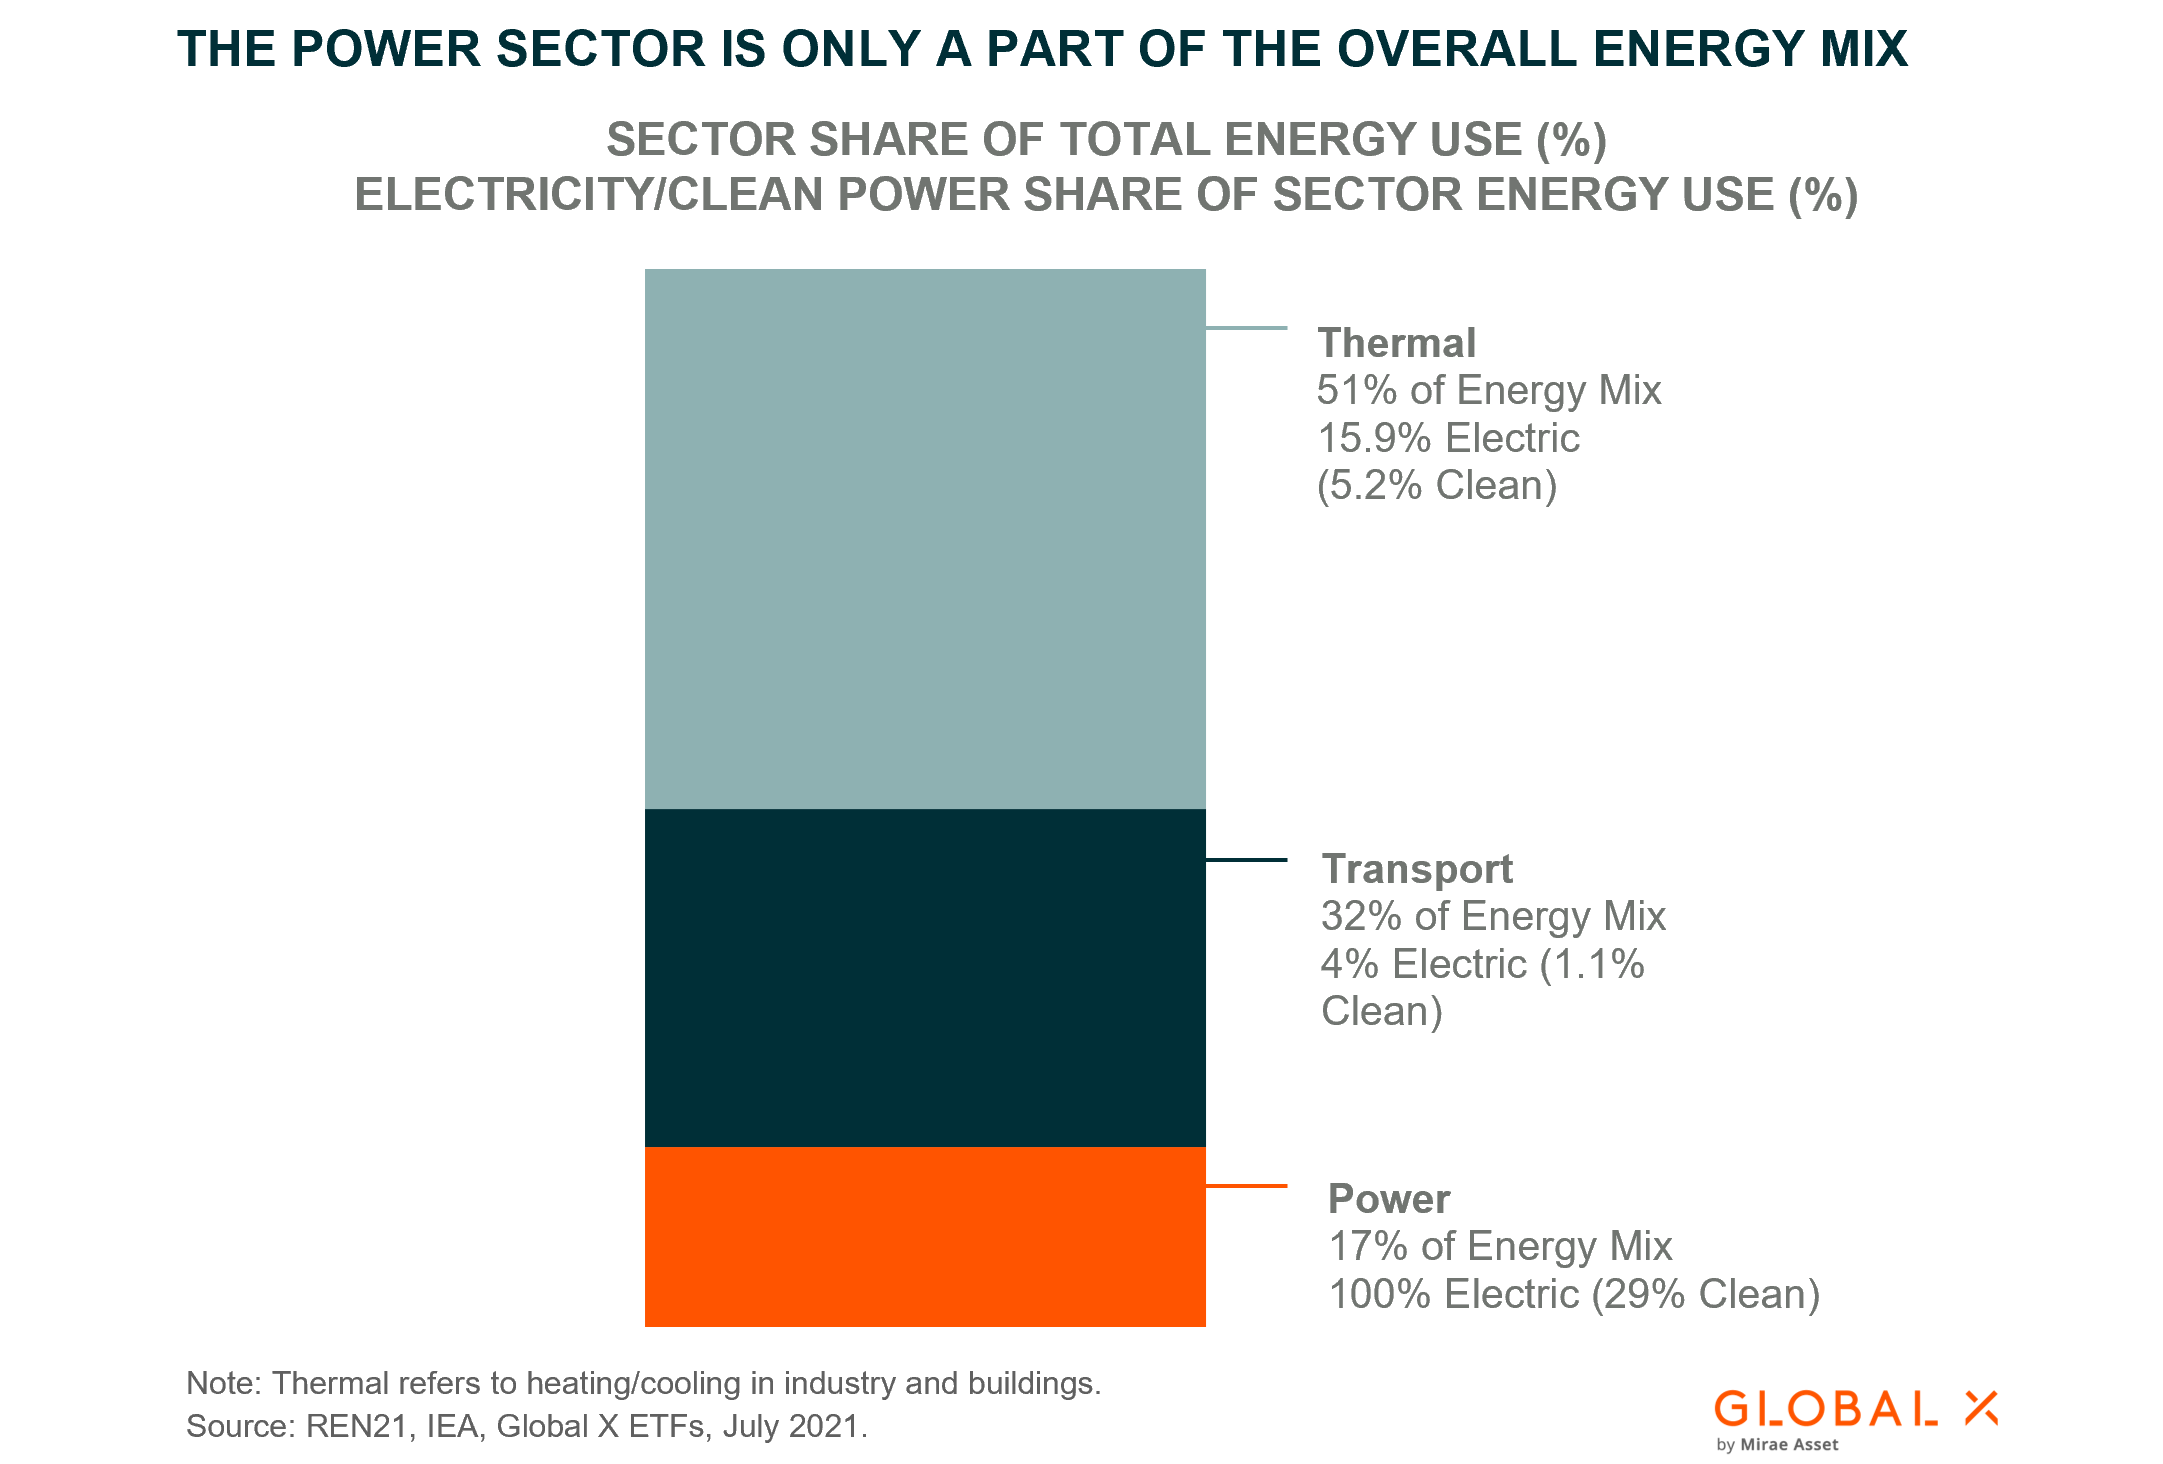
Electricity only represents 37% of total final energy consumption (TFEC), with the majority of this produced directly by the power sector. This means the remaining 63% of TFEC comes from the direct combustion of fossil fuels in transportation, buildings, and industry.26 Electrified end-uses can be decarbonised by transitioning the power sector to renewable energy sources, but for non-electrified end-uses like transportation, decarbonisation is only possible through direct or indirect electrification. Direct electrification entails transitioning away from fossil fuel-powered vehicles and building heating systems to those that run on electric power. On the other hand, indirect electrification refers to the use of electricity as an input in industrial processes rather than the replacement of fossil fuels. For instance, renewably produced hydrogen could decarbonize fertilizer and metal purification processes that otherwise emit greenhouse gas emissions. According to some estimates, substituting fossil-fuels like coal, oil, and natural gas with clean alternative energy sources could reduce emissions by 52% of what is needed to adequately limit warming.27
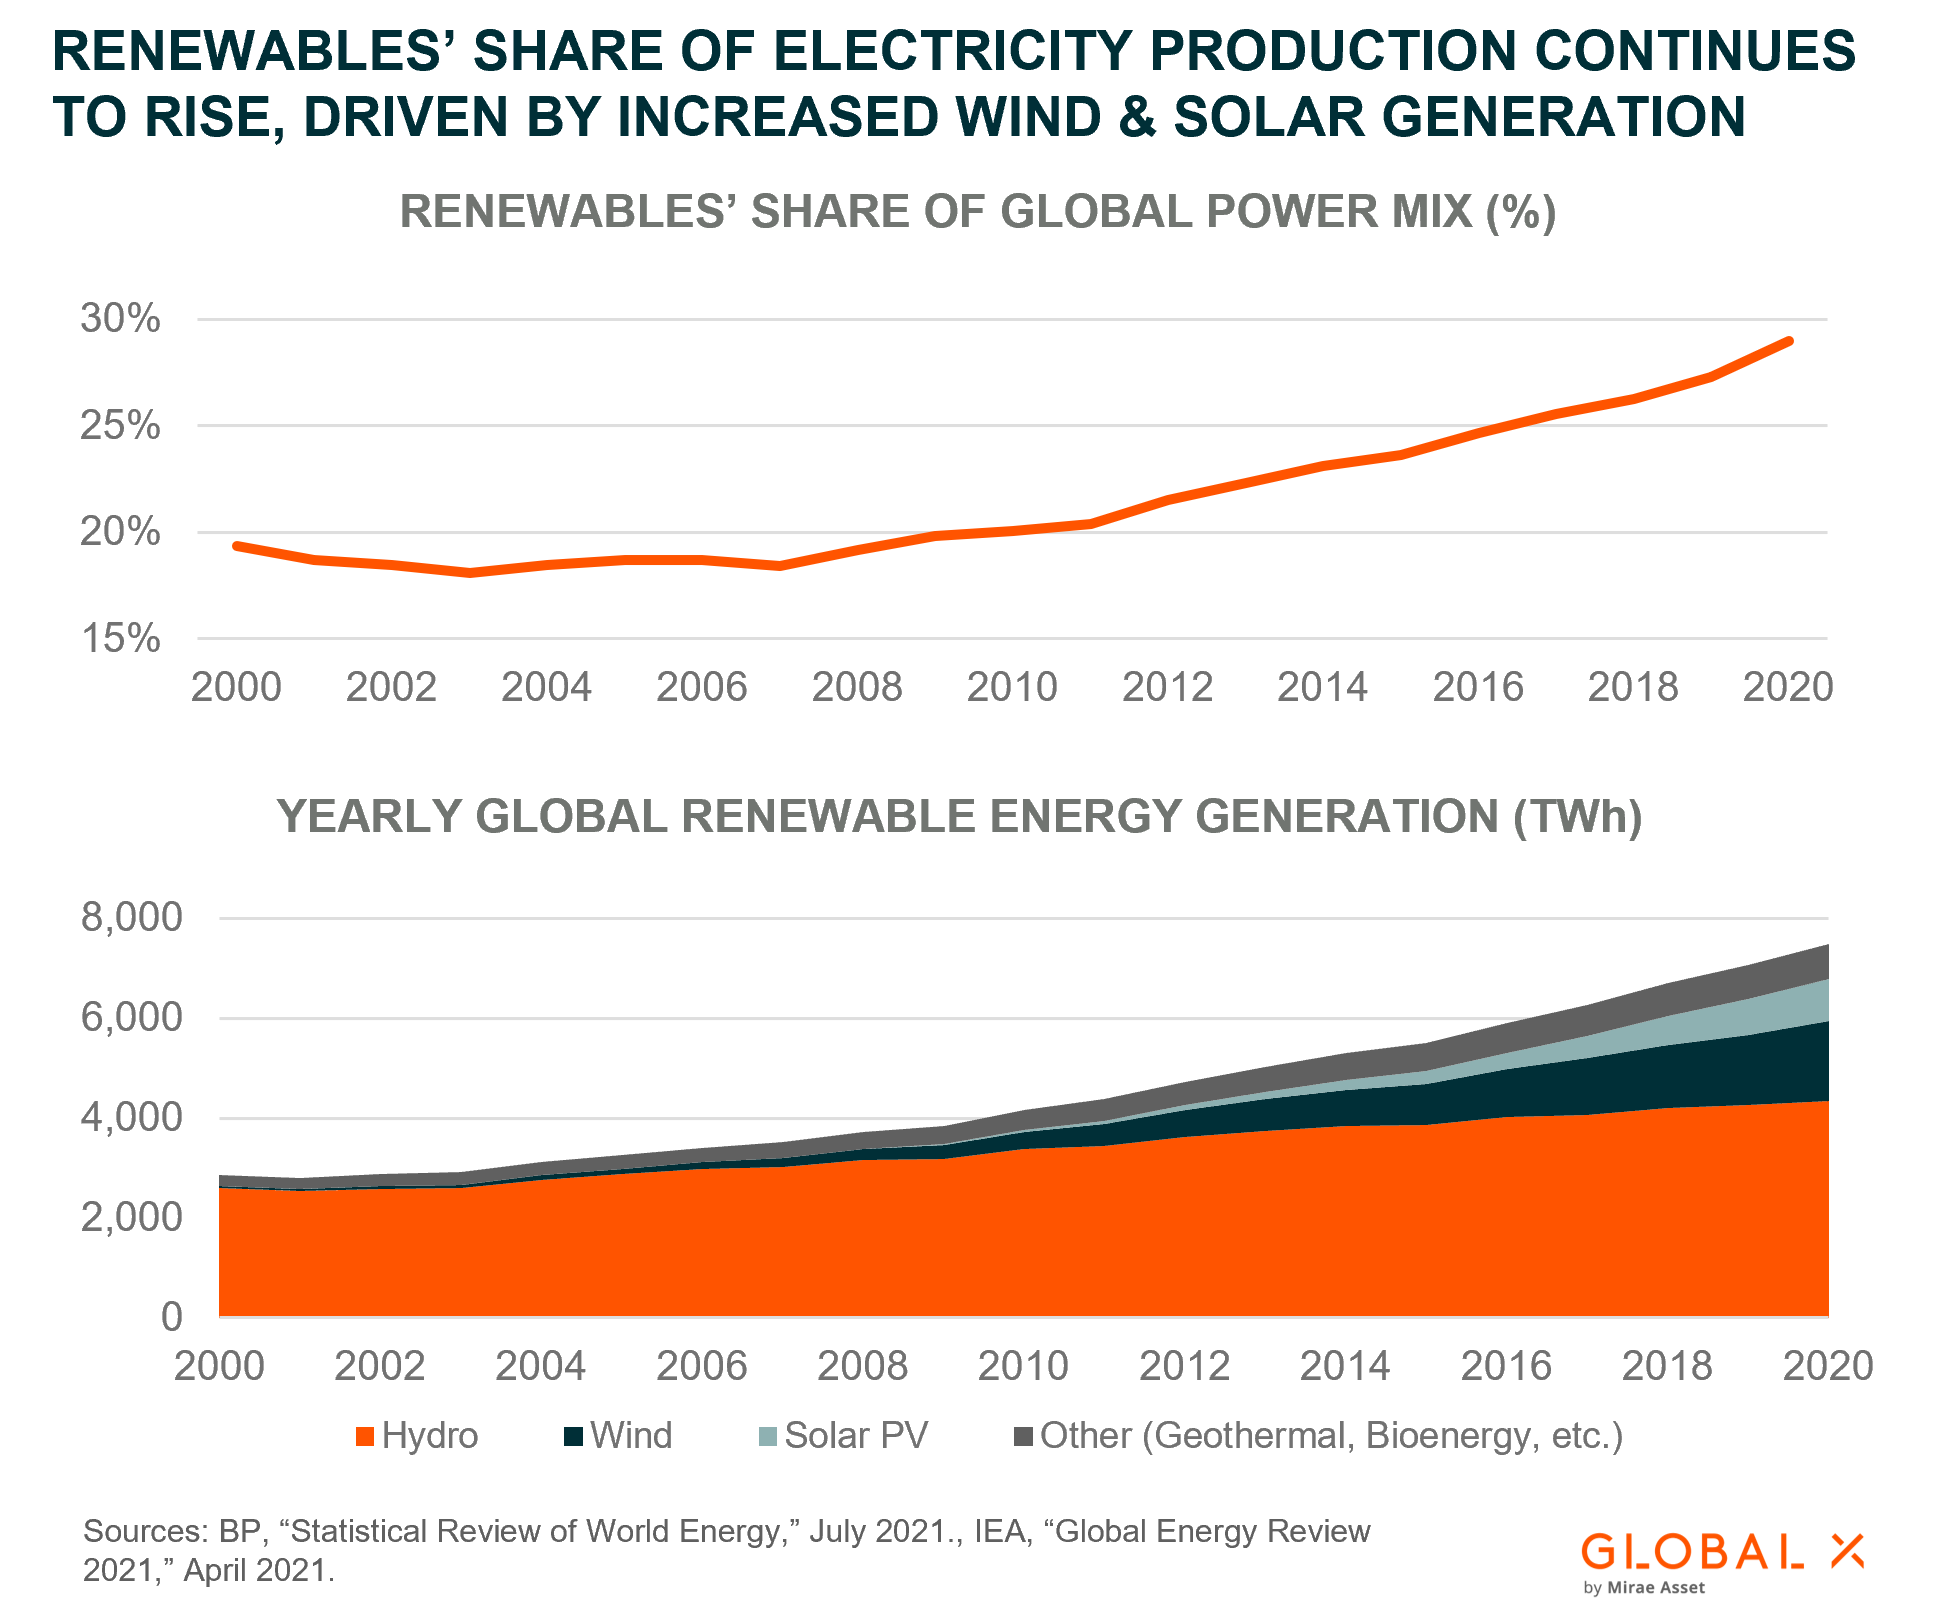
Clean energy sources’ share of global electricity production in the power sector continues to gain on fossil fuels. Renewables’ share of global electricity generation reached 29% in 2020, 2% more than at the end of 2019 and almost 10% more than at the end of 2010.28 In the past, hydroelectric sources like dams and run-of-the-river power generators represented the lion’s share of renewables in the overall energy mix. But much of the recent growth in renewable energy capacity can be attributed to innovation and rapidly decreasing costs of renewables like solar photovoltaic and wind power.
The levelized cost of electricity (LCOE) refers to the revenue required to build and operate a power source over a specified cost recovery period. Over the past ten years, the LCOE of solar PV and wind power decreased 80% and 55%, respectively, making them more affordable than fossil fuels in most of the world.29 Correspondingly, solar electricity generation (by TWh per year) increased 27x over the same time period, while wind increased 4x.30
This growth could continue as greater investment, supportive policies, economies of scale, and market forces further reduce the cost of components like wind turbines and photovoltaic cells.31 In most markets, costs associated with renewable energy are already below coal and gas plant costs, presenting significant incentives to transition further into clean energy. Even Texas, the U.S.’s largest producer of fossil fuels and fastest growing state by population, relies on the cost effectiveness of wind power to meet growing power demands.32
By the end of the decade, the cost of solar is expected to fall another 55% – 62%, while costs associated with onshore and offshore wind could fall by 45% and 50% respectively, potentially making the economics of renewable energy even more attractive.33 Aggressive policy shifts are also likely to promote renewables adoption. The world is only on track to generate 23% of its total energy usage renewably by 2050 and will need coordinated efforts to approach the 74% share required to hold long-term warming to 1.5°C.34
For more detailed information renewable energy sources please see related research on wind and solar.
Connected, But Distinct Themes: How Renewable Energy Production and CleanTech Differ
While the renewable energy production and cleantech value chains are inherently intertwined, we view these segments as separate investment themes. The renewable energy production theme targets companies that generate electricity from sustainable sources, including wind, solar, hydroelectric, geothermal, and bioenergy sources. These companies then sell that electricity at either market or contracted rates. Given these business models, they are typically classified as Utilities companies and share similar characteristics with traditional Utilities, such as lower volatility and more consistent earnings. But while Utilities often pay an above average dividend yield, renewable energy producers often feature lower yields and higher growth prospects.
The CleanTech theme differs from renewable energy production in that it skews further “upstream,” focusing on companies that manufacture the components used for renewable generation like wind turbines, solar panels and cells, and solar inverters. CleanTech encompasses business activities like renewable installation and maintenance, as well as renewable-enabling activities related to smart grids, storage, electrification, and energy efficiency. It can also include technologies related to carbon capture, use, and storage, which can reduce emissions. Most companies tied to the CleanTech theme are in the Technology and Industrials sectors, and as a result, CleanTech offers more tech-like higher-risk, higher-reward potential payoffs than renewable energy production.
RNRG: A Focus on Pure Plays in Renewable Energy Production
The Global X Renewable Energy Producers ETF (RNRG) tracks the Indxx Renewable Energy Producers Index and provides access to dozens of leading companies in the Renewable Energy Production theme. It seeks to invest in companies that generate over 50% of revenues from producing energy from renewable sources including wind, solar, hydroelectric, geothermal, and biofuels.
There are several potential ways to implement this theme in a portfolio. For sector-based allocations, replacing traditional Utilities exposure in favor of renewable energy production may help improve a portfolio’s growth characteristics without dramatically changing its risk exposures. For sustainable-oriented portfolios, an allocation to renewable energy production instead of traditional Utilities or Energy can help reduce its overall carbon footprint. And finally, for core-satellite portfolios, this theme with its potentially lower volatility could provide some ballast and diversification when joined with allocations to several disruptive tech-focused themes, including CleanTech.
Related ETF
RNRG: The Global X Renewable Energy Producers ETF seeks to invest in companies that produce energy from renewable sources including wind, solar, hydroelectric, geothermal, and biofuels.
Click the fund name above to view the fund’s current holdings. Holdings subject to change. Current and future holdings subject to risk.